- Published
- Research
- AI/ML
- Team
- 2025
3D flood visualization for Jakarta
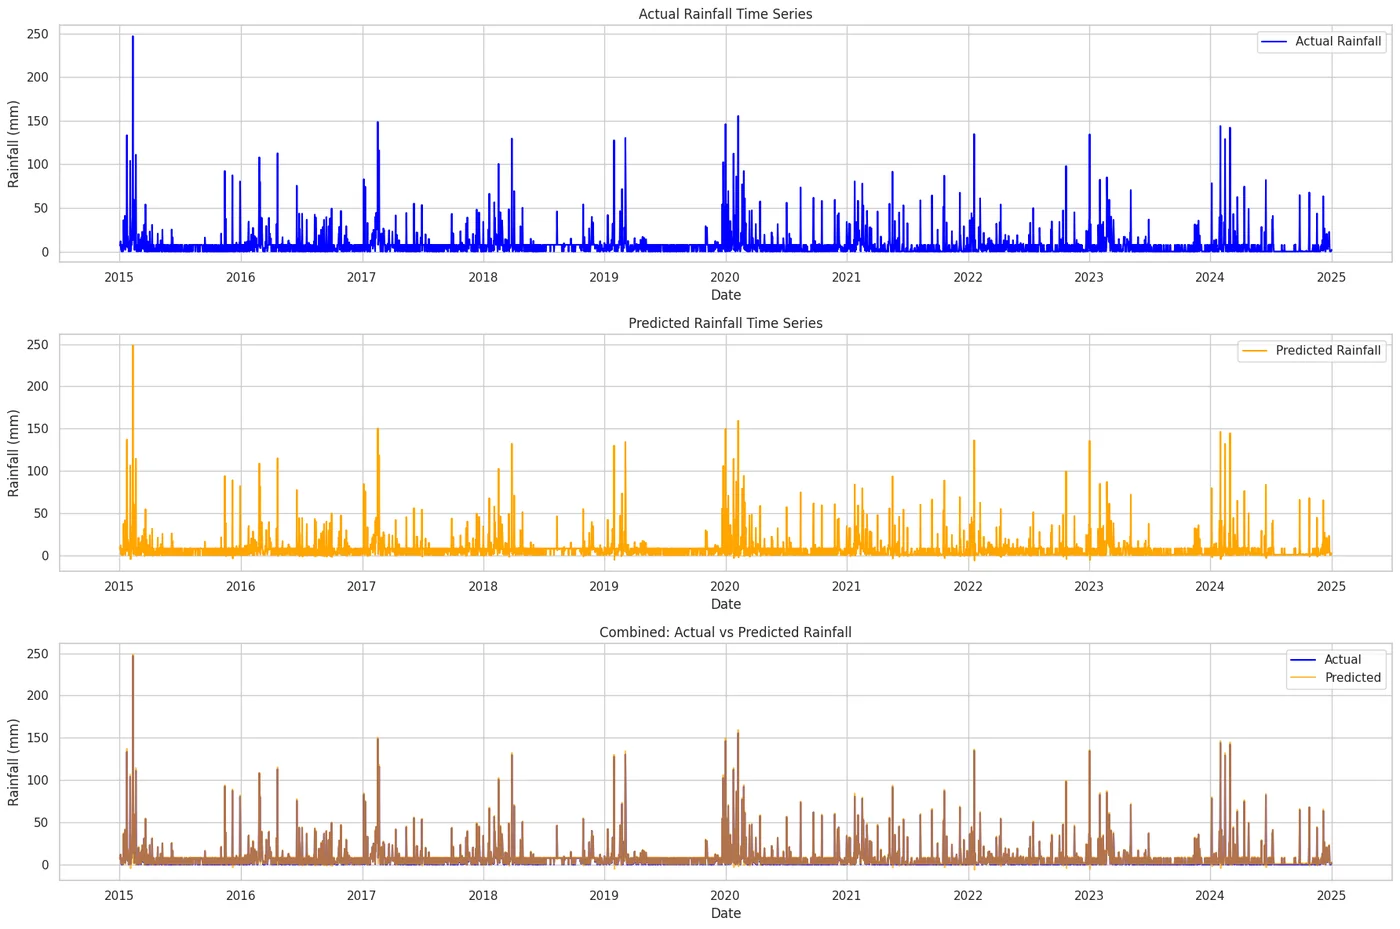
LSTM rainfall forecasting feeding an ANUGA flood simulation, rendered as an interactive 3D map. Published at ICCSCI 2025.
How it works
- 01LSTM forecasts rainfall
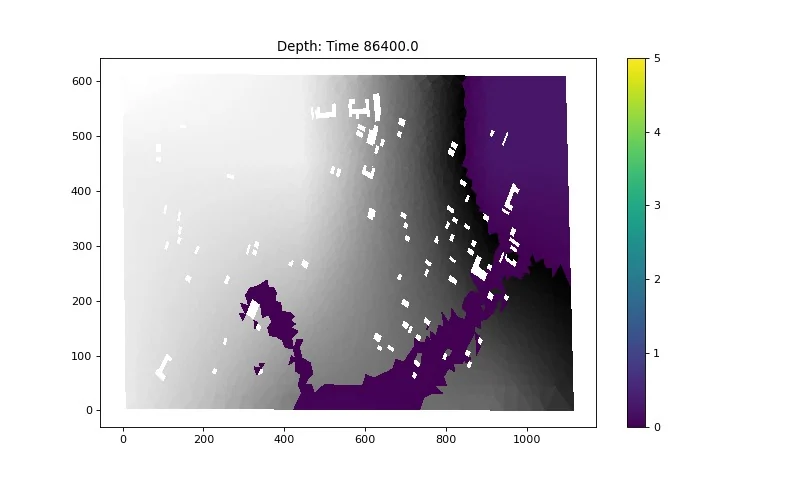
- 02ANUGA simulates flood spread from the forecast
- 03Leafmap renders the result as a 3D map
Rainfall LSTM R²MAPE 3.3%; the forecast feeds an ANUGA flood simulation.
Rainfall LSTM R²
MAPE 3.3%; the forecast feeds an ANUGA flood simulation.
Water rising over a basin
An illustration of how the 3D map shows flood spread over time. Not the paper's simulation output.
The problem
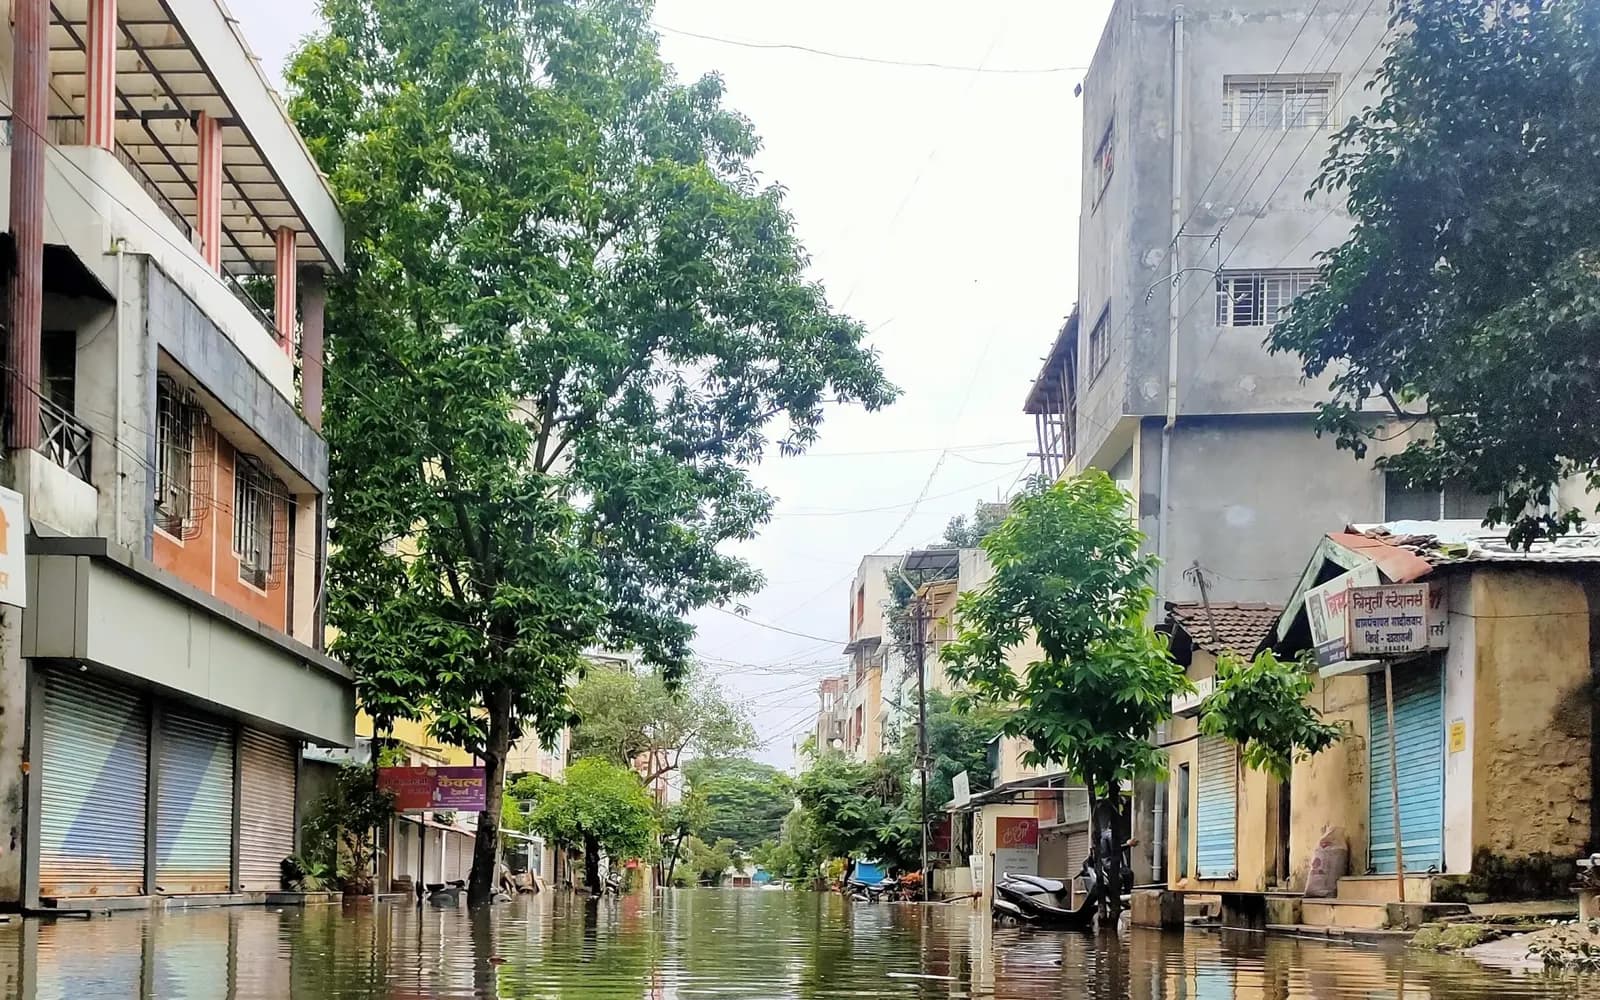
Jakarta floods every rainy season, but rainfall forecasts alone do not show which streets go under water.
My part
Co-author (2nd of 4) of the published paper.
Second of four authors.
Limitations
- A research system for one urban area, not an operational warning service.